


Originally published in French in September 2022. Read the French version. Screenshots and charts are in French.
During my talk at SEO Campus Paris 2022, I showed how powerful Google’s Looker Studio can be (the tool was still called Data Studio at the time). The tool really comes into its own when you blend several data sources together. You get tailor-made dashboards that cross the sources that actually matter for your business. An SEO dashboard coupled with a recent crawl, a semantic analysis that includes the keywords you already rank for, or a Discover analysis to publish more relevant articles in the future: everything is possible.
Contents:
Simple data sources
Google Analytics
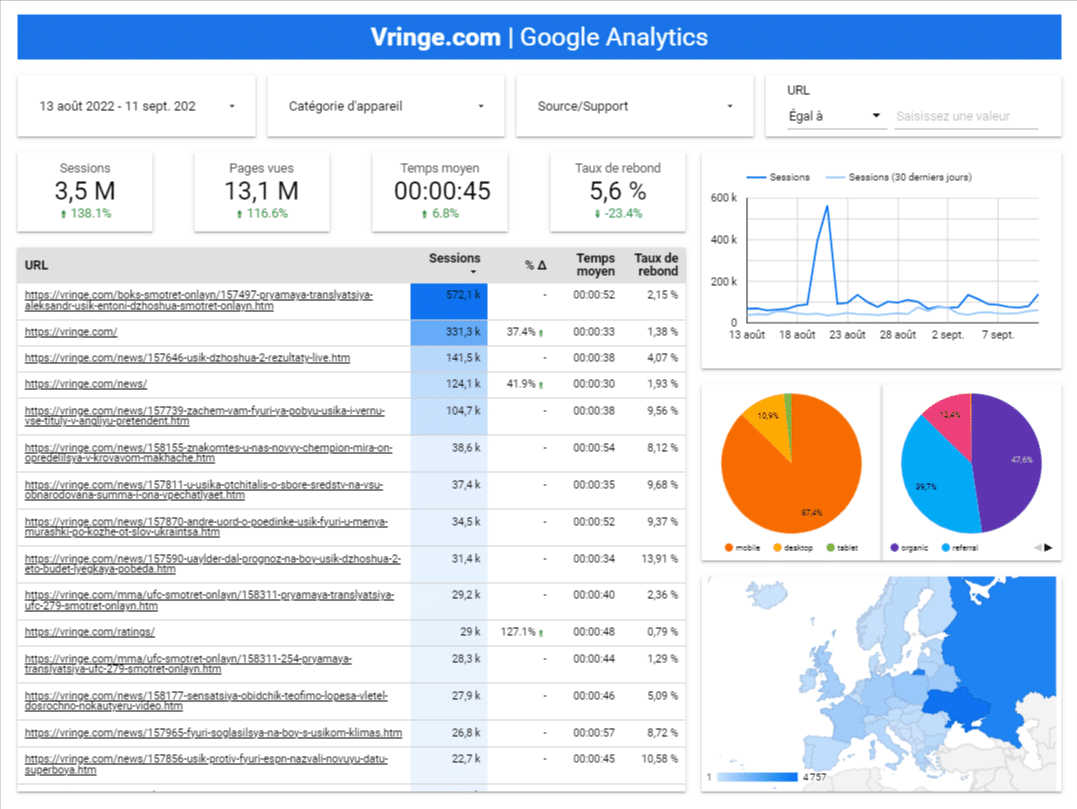
One of the easiest sources to plug into Looker Studio is Google Analytics (Universal Analytics or Google Analytics 4). You get a multitude of fields to build a detailed dashboard on your website’s traffic.
A great advantage of Looker Studio is that it lets you connect several Analytics sources from different accounts: once the first connection is made, the data can be used from other accounts. You can even make data sources reusable for future reports.
Feel free to combine filters for a more detailed analysis: device category, traffic source, landing page URL and so on.
Google Search Console
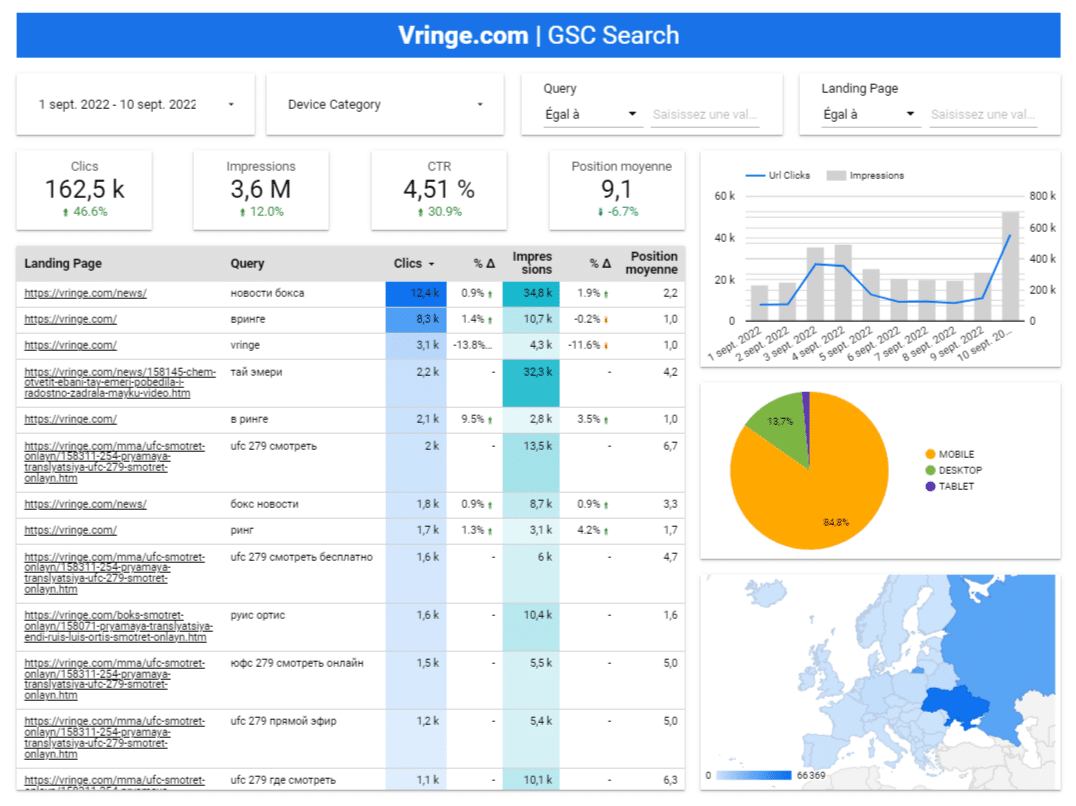
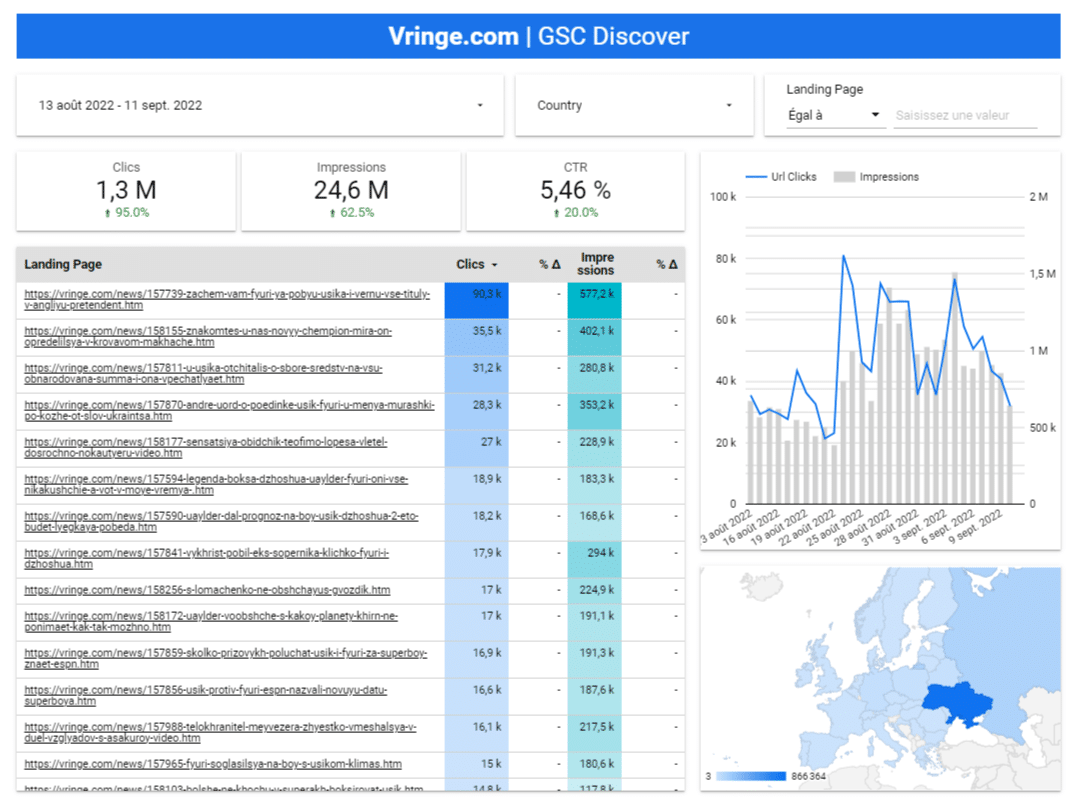
Like Google Analytics, Google Search Console is very easy to plug into Looker Studio. Note that you need to create a separate data source for each search type in GSC: Search, Image, News or Discover.
As in the official Search Console interface, you have to wait two days to get reliable visibility data.
External data sources
Screaming Frog export and Google Sheets
Looker Studio can pull data from Google Sheets, which is very handy for bringing external data into the dashboard.
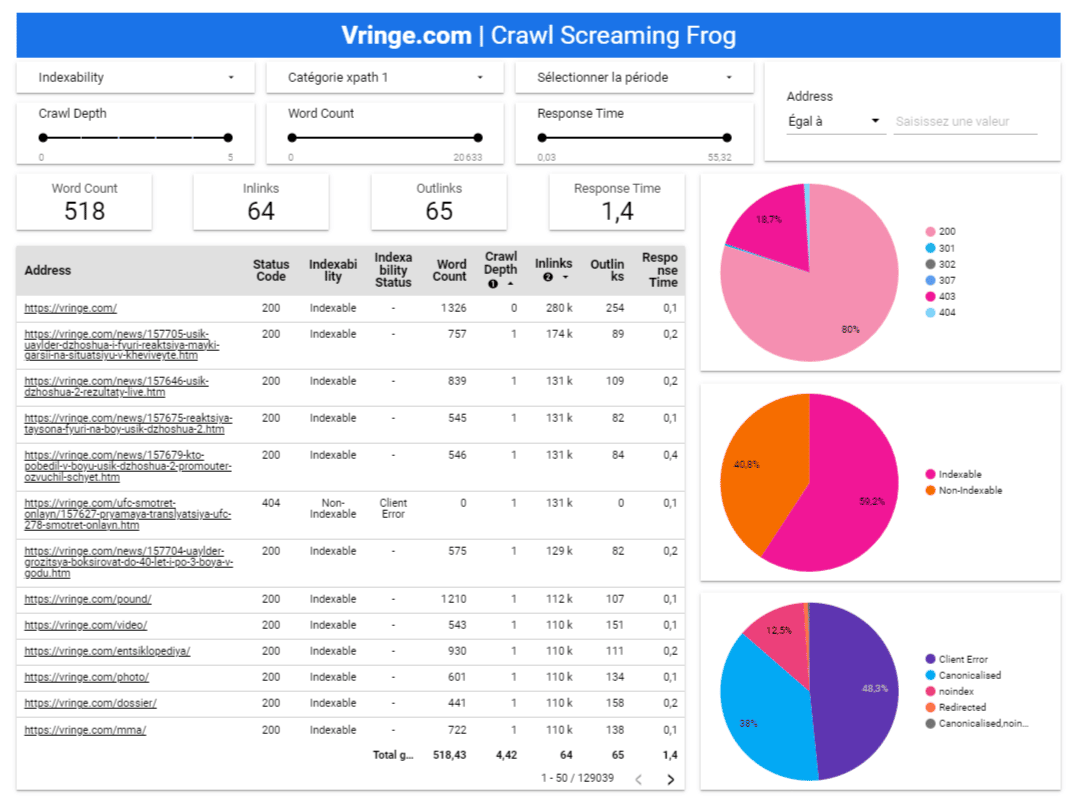
Since version 17, Screaming Frog lets you schedule regular crawls and export them easily to a Google Sheets document. You can set up a weekly crawl, for example, and automatically send the crawl data in place of the previous week’s. You choose the exports you want from Screaming Frog: all internal links, HTML pages, pages with mixed content, missing meta descriptions. Every export available in the regular version of the crawler.
With well-chosen filters, you can then build views around the issues to isolate or the improvements you want to work on.
Through an API: Ahrefs
Looker Studio can also pull data through APIs. The main SEO tools offer data export, more or less simply, straight into Looker Studio.
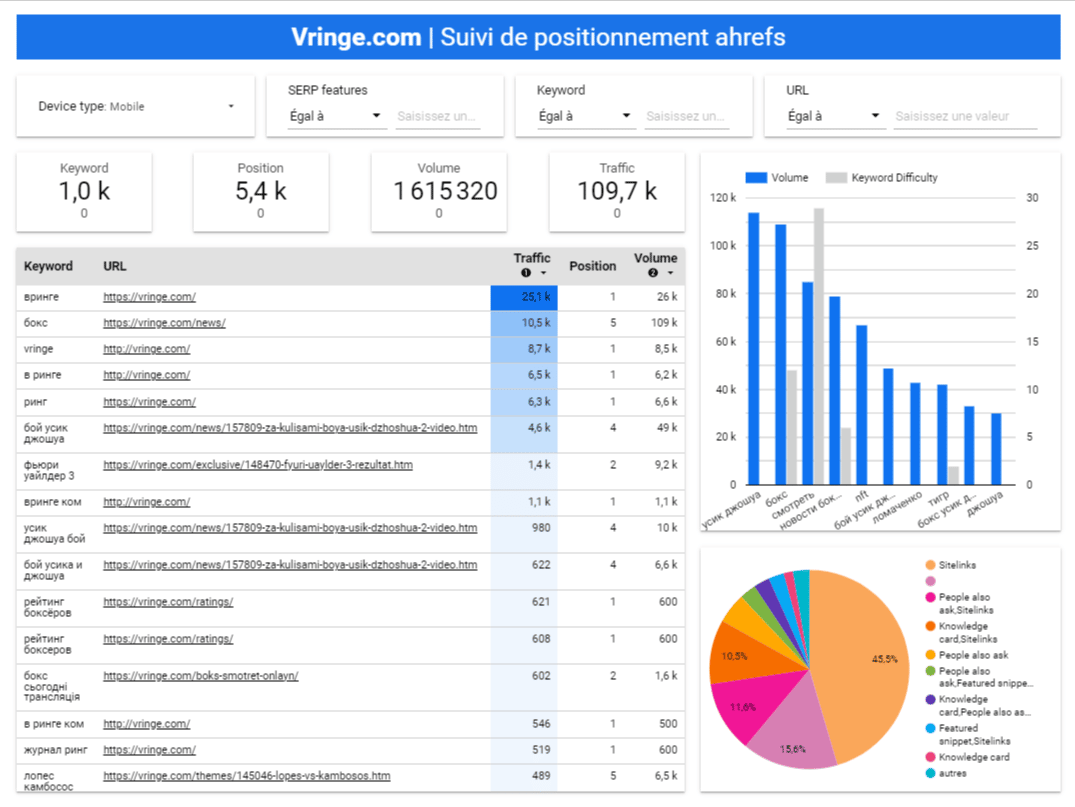
That is the case of the rank tracker in Ahrefs, which requires a subscription. You can bring into Looker Studio the keywords you entered in your Ahrefs project. The tool also makes you choose between mobile and desktop tracking, with the option of adding a filter in the report to switch device.
Blended data sources
All this data is interesting, but in the end you have nothing more than what each tool already shows you. The whole point of building your own dashboard is to combine the data that matters to you.
Search Console blended: Search and Discover
Let us start with something simple: blending two Search Console sources, to bring together the data from Google’s different surfaces. It is all the easier because the fields are almost identical across those sources.
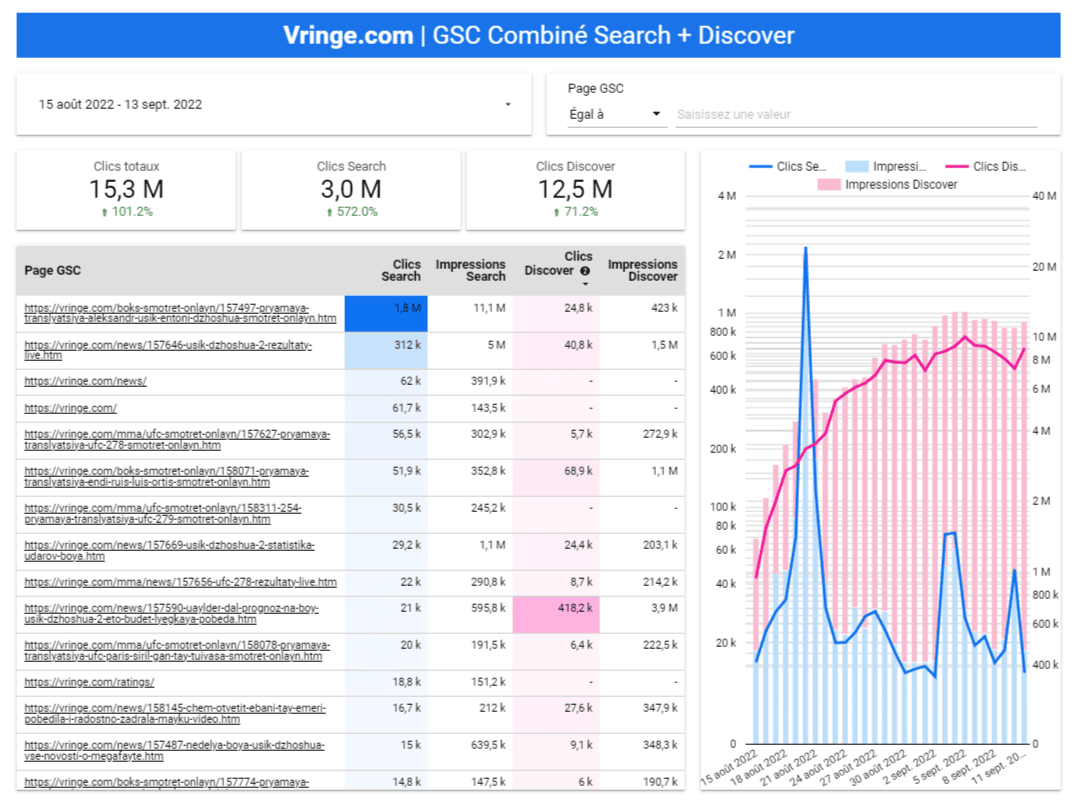
Below, Search and Discover results are blended to see which URLs perform best and to compare the click and impression curves. You could also add traffic from Google Images and Google News, depending on your site.
The only constraint: you cannot blend more than 5 data sources together.
A dynamic SEO dashboard
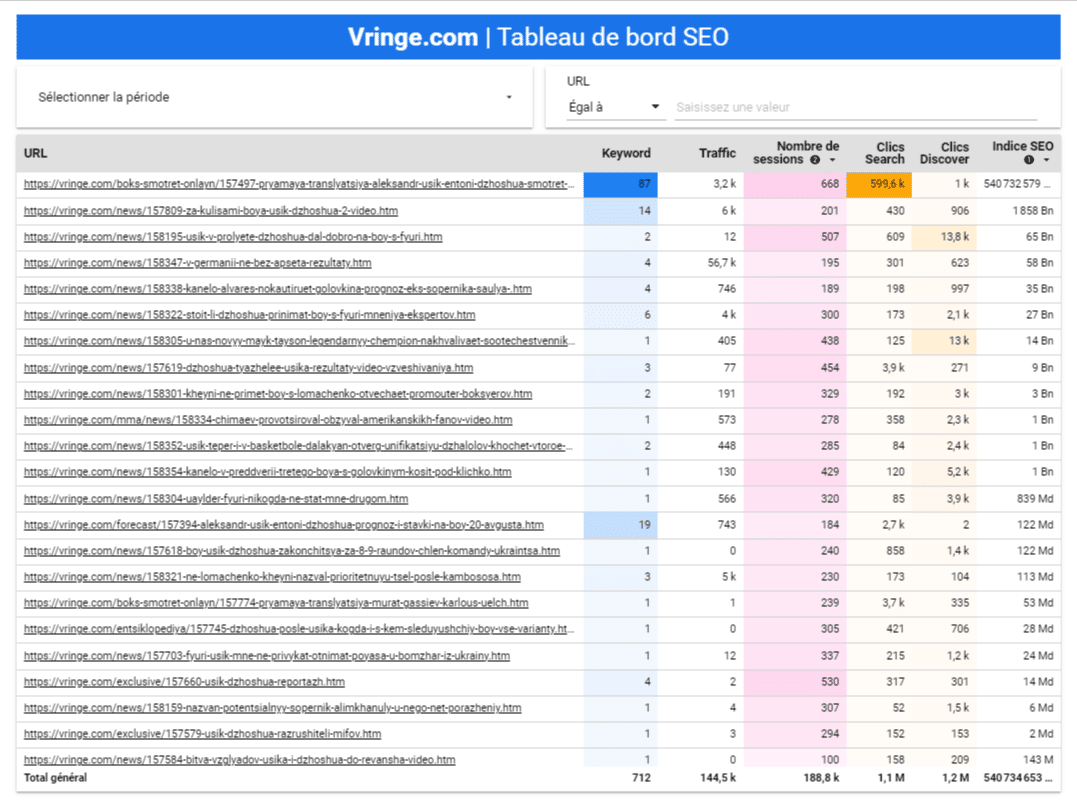
More interesting: picture an SEO dashboard with all the traffic sources we care about together: Ahrefs rankings, Google Analytics sessions, Search clicks and Discover clicks (backlinks could be added too). This gives you your best SEO pages, and the worst ones to rework or remove.
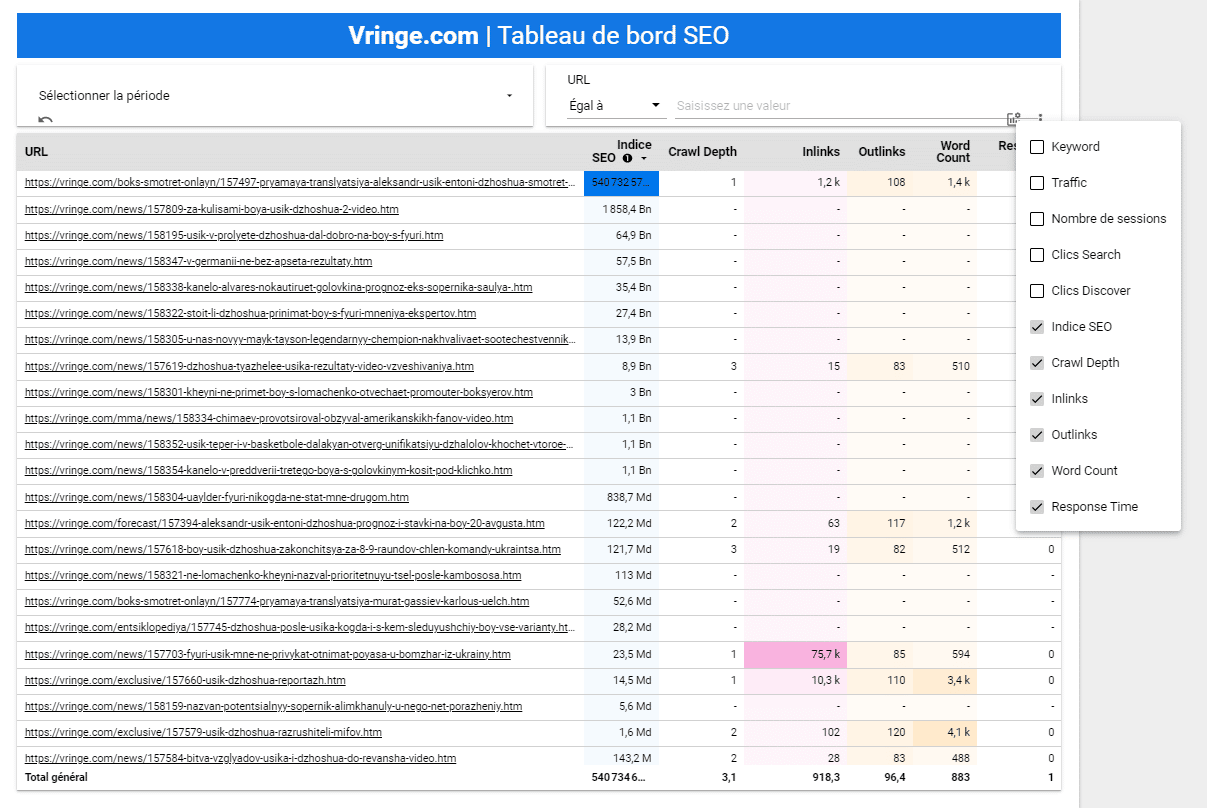
Everything is coupled with the Screaming Frog crawl, so you can correlate with word count, depth, number of internal links or load time. You could also add Googlebot hits to do cross log analysis and work out the ideal figures to improve Google’s crawl.
Discover analysis: where and when to publish?
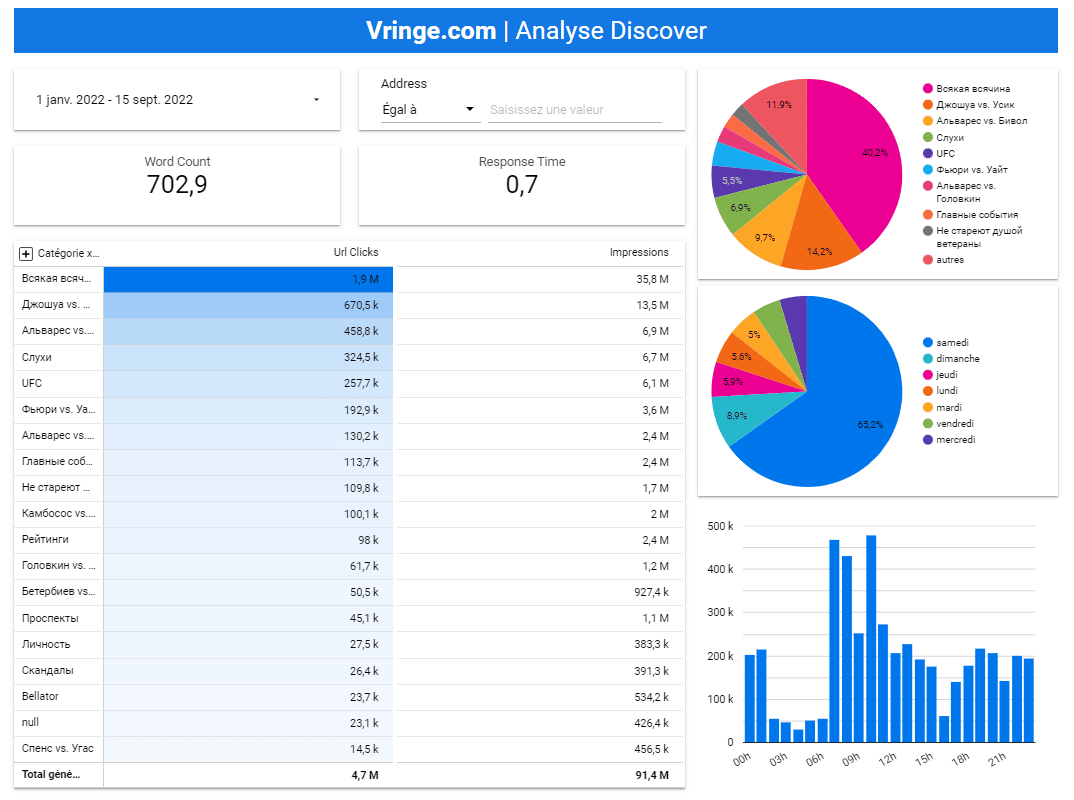
Is yours a news site, and are you interested in Discover? Picture a page dedicated to this significant traffic source, to find out which types of articles get the most visibility: categories that work, when to publish (day of the week and time of day), word count, response time.
This type of analysis can of course be used for regular Search too. Here Search Console is simply blended with the Screaming Frog crawl, with a little XPath to scrape publication data.
Semantic analysis tied to live rankings
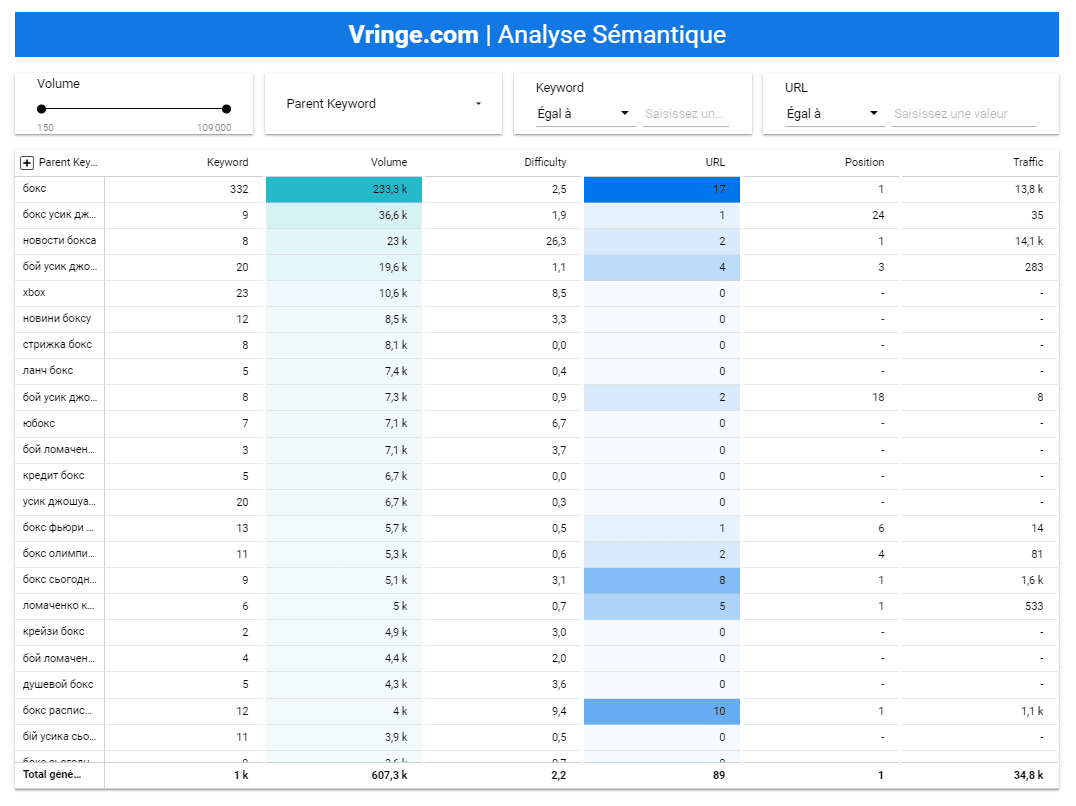
Finally, would you not like a semantic analysis that updates every day? To know which semantic fields are already covered and which still need work before you rank.
Here a pivot table blends a Google Sheets document holding the semantic analysis (which categorises the keywords) with the matching keywords in Ahrefs. At a glance, you can decide on future content production.
As you can see, Google gives us a powerful and free tool. Apart from the limit of 5 blended data sources, your dashboard has no limit other than your imagination.